SABICEquity research · 2010.SR
Information date: 21 July 2026Download PDF
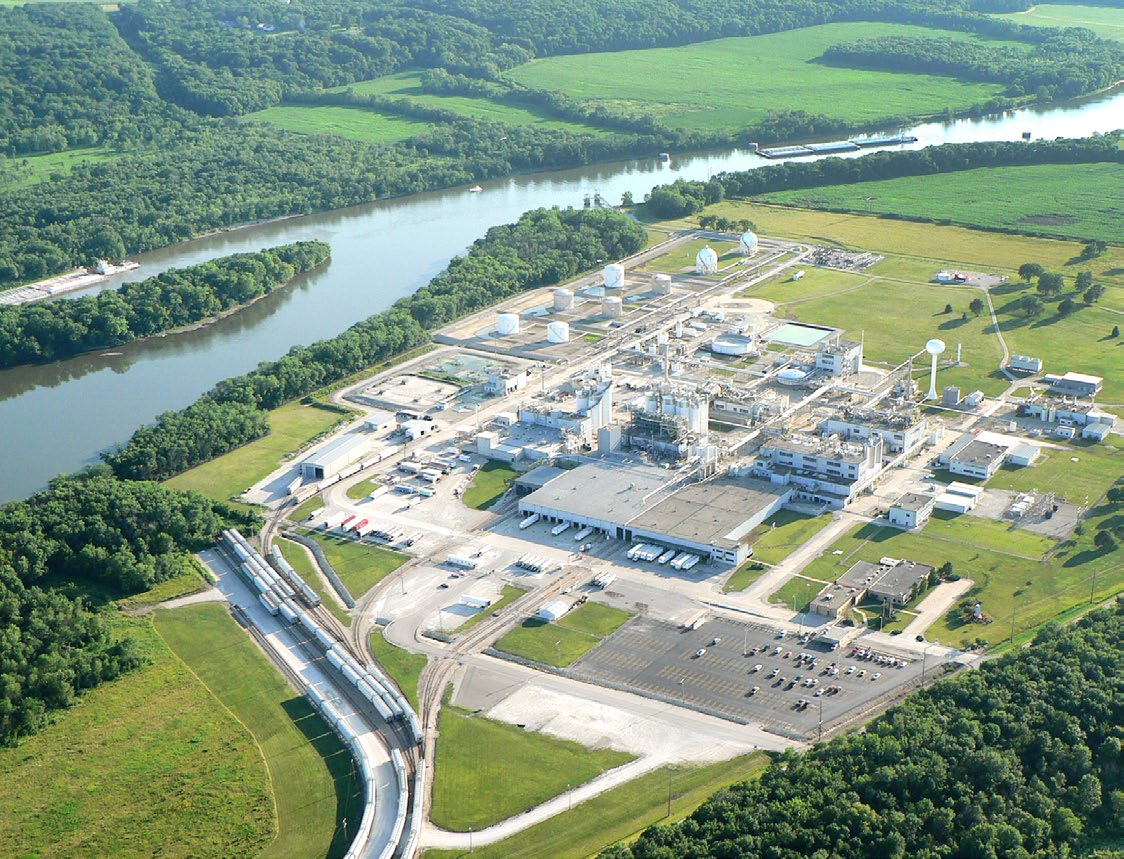
SABIC production site and logistics infrastructure.
Equity researchSaudi Arabia · Chemicals

Initiation of coverage

Saudi Basic Industries Corporation

Cash generation and project execution support long-term value, but the base case does not yet compensate for cyclical pricing and terminal-value risk.

Tadawul 2010SAR21 July 2026
HoldIndicative research view*
SAR 52.20Reference price
SAR 52.90DCF fair value
1.3%Price return
SAR 3.0012-month dividend
7.1%Total return

*Indicative research view based on the stated assumptions; prepared for professional evaluation and not regulated investment advice. Cover image: SABIC Integrated Annual Report 2025, p. 4.

Research scorecard

Information dateReference priceDCF fair value12-month dividendTotal returnIndicative rating
21 July 2026SAR 52.20SAR 52.90SAR 3.007.1%Hold

The reference price is a point-in-time market-data cross-check; financial inputs reconcile to official filings. Q1 2026 report

Forecast snapshot

MetricFY2025 baseFY2026EFY2027EFY2030E
RevenueSAR 116.53bnSAR 111.87bnSAR 120.26bnSAR 138.54bn
Adjusted EBITDA margin15.3%15.6%16.8%18.2%
Adjusted EPSSAR 0.69SAR 1.23SAR 1.87SAR 2.94

E denotes analyst model estimates. Reported EPS is not forecast because divestiture and exceptional-item accounting remain uncertain. FY2025 annual report

Scope of analysis

This initiation-style report assesses SABIC using public information available through 21 July 2026. Forecasts are analyst estimates and the valuation is derived from the stated FCFF, cost-of-capital and scenario assumptions. The indicative rating is provided for professional evaluation and is not regulated investment advice.

1

Investment Summary and Recommendation

Central valuation, forecast direction and the evidence that would change the call.

Why the operating recovery does not yet justify a Buy

Our Hold view is not a call for flat earnings. The base case assumes that adjusted EBITDA margin recovers from 15.3% in FY2025 to 15.6% in FY2026 and 18.2% by FY2030, while adjusted EPS rises from SAR 0.69 to SAR 1.23 and then SAR 2.94. The issue is the price already paid for that recovery. Our FCFF DCF produces SAR 52.90 per share against a SAR 52.20 reference price. The next twelve-month dividend lifts modeled total return to 7.1%, but central-case price appreciation is only 1.3%.

The market therefore does not need a full earnings disappointment to challenge the valuation. It only needs recovery to arrive later or require more capital than assumed. A 100 bp increase in WACC reduces our value by about 17%, while a 150 bp margin shortfall reduces it by about 16%. This asymmetry matters because 79.8% of enterprise value is derived from cash flows beyond FY2030. Near-term execution evidence has less time to compound than a change in long-duration assumptions.

The constructive part of the thesis is operational. SABIC enters the investment cycle with low balance-sheet leverage, a broad manufacturing footprint, and disclosed projects that can expand saleable output. The Fujian complex is the largest identifiable growth mechanism, but our forecast does not treat construction completion as revenue. We assign only a 0.5% project-ramp contribution in FY2026 and 3.5% in FY2027, with later growth tapering as the asset approaches a more normal operating state.

A Buy would require evidence that the earnings recovery is both faster and less capital intensive than our base case. The most credible route is a combination of better product price/mix, recurring transformation savings, timely Fujian commissioning and free-cash-flow coverage of the dividend. A Sell would become more likely if weak spreads persist while capex and working capital remain elevated, because that combination would erode both earnings and the balance-sheet support for distributions.

The recommendation is derived from the stated forecast and valuation assumptions; it is not management guidance. FY2025 annual report, Q1 2026 earnings release

Investment view

The base case points to SAR 52.90 per share and 7.1% total return including the next twelve-month dividend. The resulting Hold indication reflects limited central-case upside, while the wide scenario range shows that product pricing, utilization and project execution dominate valuation risk.

Scenario valuation range

Scenario value versus the reference priceSAR 13SAR 39SAR 64SAR 90SAR 116Market SAR 52.20Bear caseSAR 15.67Base caseSAR 52.90Bull caseSAR 99.86

SAR per share. Scenarios vary operating assumptions, WACC and terminal growth together.

What drives the call

MechanismBase-case viewEvidence to monitorFinancial effect
Petrochemical price and mixWeak in FY2026, then gradual normalizationQuarterly management price/mix bridge and chemical proxiesRevenue and EBITDA margin
Fujian projectInitial H2 2026 contribution; larger FY2027 rampMechanical completion, start-up and utilization disclosuresVolume, capex and working capital
Portfolio simplificationContinuing perimeter is forecast separatelyClosing terms, retained liabilities and proceedsReported EPS, net debt and valuation adjustments
Transformation savingsMargin recovery remains conditionalRecurring savings and conversion-cost disclosureEBITDA and cash conversion
DividendSAR 3.00/share in FY2026 base caseFCF coverage, liquidity and board recommendationEquity return and liquidity

FY2025 annual report, Q1 2026 release

2

Thesis and Variant View

The investment case is expressed as testable operating mechanisms rather than a narrative forecast.

Variant perception and proof points

A superficial recovery thesis would extrapolate lower rates, improving chemical prices and announced capacity into a conventional cyclical rebound. We take a narrower view. SABIC can report higher EBITDA without creating equivalent equity value if working capital, capex, non-controlling interests or divestiture leakage absorb the cash. Our variant question is therefore not simply whether EBITDA recovers; it is whether recurring cash returns improve after funding the asset base and protecting the balance sheet.

Three proof points matter. First, quarterly price/mix must improve without being offset by weaker operating rates. Second, project disclosures must progress from mechanical completion to commissioning, utilization and commercial qualification. Third, EBITDA must convert into cash after capex and working capital. The FY2026 base case deliberately keeps price/mix at negative 6.0%, assumes only 1.5% volume growth and allows a 0.5% project-ramp contribution. This is more conservative than treating the full project nameplate as immediately productive, but it still embeds a transition from a difficult FY2025 base.

The thesis can be wrong in two directions. We may be too cautious if constrained industry supply, stronger Asian demand and recurring cost savings raise spreads faster than assumed. We may be too optimistic if new global capacity prolongs weak utilization, or if the Fujian complex reaches mechanical completion but takes longer to achieve product qualification and steady-state output. Because both outcomes are plausible, the report uses explicit bear, base and bull paths instead of presenting a single forecast as certainty.

Our base case should be read as a set of falsifiable mechanisms. Price/mix, volume, project ramp, margin, capex and working capital are separately observable. When new evidence arrives, the relevant assumption should be revised and its effect traced consistently through Revenue, adjusted EPS, FCFF and valuation.

Probability judgments are analyst assessments. Operating proof points are anchored to official quarterly and project disclosures. SABIC strategic projects, Q1 2026 report

Central hypothesis

The analytical question is whether portfolio simplification, transformation savings and new capacity can restore recurring returns faster than weak global chemical pricing erodes them. The report does not assume that announced capacity becomes immediate production; construction, commissioning, ramp-up and steady-state operation remain separate forecast states.

FY2025 strategic projects

Operating mechanisms and financial transmission

HypothesisFinancial transmissionObservable KPIFY2026 treatment
Cycle trough stabilizesProduct balance -> realized price/mix -> segment revenuePrice/mix change and benchmark direction-6.0% price/mix
Volumes improveUtilization/project ramp -> sales volume -> revenueVolume bridge and start-up milestones+1.5% volume; +0.5% project ramp
Margins normalizePrice/spread + transformation -> EBITDA marginAdjusted EBITDA margin15.55%
Cash supports payoutEBITDA -> CFO -> capex -> FCF -> dividendFCF and liquiditySAR 3.97bn FCF

Falsification conditions

  • Fujian start-up moves materially beyond H2 2026 or disclosed utilization ramps more slowly than assumed.
  • Price/mix or segment EBITDA margins remain below the bear-case path despite improving market proxies.
  • Working-capital consumption and project capex keep free cash flow below dividend requirements.
  • Divestiture proceeds, retained liabilities or discontinued-operation charges materially differ from the current treatment.
  • Transformation savings do not recur in reported segment economics.
3

Company, Ownership and Business Model

Portfolio breadth, ownership and end-market exposure define both resilience and cyclicality.

SABIC's strategic portfolio is increasingly tied to energy transition and lower-carbon applications.Research and product development remain central to portfolio differentiation.
Figure 1. SABIC's strategic portfolio is increasingly tied to energy transition and lower-carbon applications. Research and product development remain central to portfolio differentiation. SABIC Integrated Annual Report 2025 (pp. 22, 36)

How the portfolio converts feedstock and capacity into earnings

SABIC is economically a portfolio of conversion spreads rather than a single-product manufacturer. Feedstock and intermediate inputs are converted through large, capital-intensive assets into commodity chemicals, polymers, fertilizers and differentiated materials. Revenue therefore responds to both physical volume and realized product mix, while EBITDA depends on the spread between selling prices and feedstock, energy, logistics and conversion costs. High utilization can support unit economics, but it can also amplify a weak market if additional output is sold into oversupply.

The Q1 2026 segment mix illustrates why consolidated Revenue alone is insufficient. Petrochemicals generated about 83% of segment Revenue but only a 10.9% EBITDA margin. Agri-Nutrients represented roughly 10% of Revenue and produced a 50.7% EBITDA margin, while Specialties represented about 6% of Revenue at a 26.4% margin. Small changes in the high-margin businesses can therefore affect group EBITDA disproportionately, although non-controlling ownership means not every unit of consolidated profit accrues to SABIC shareholders.

Saudi Aramco's 70% ownership is strategically important but should not be translated into assumed private economics. Parentage may support feedstock coordination, capital access and strategic alignment, yet public disclosures do not reveal every transfer-pricing term or contractual protection. Our model uses disclosed group financials and subtracts non-controlling interests from consolidated enterprise value. It does not assign an unverified parent-company premium.

The reporting perimeter is also moving. Announced European Petrochemicals and regional Engineering Thermoplastics divestitures are treated as discontinued or transaction-dependent rather than recurring operations. This distinction protects the operating forecast from one-off disposal accounting, but it creates a separate equity bridge for proceeds, taxes, stranded costs and retained liabilities. Until closing terms are fully disclosed, the report does not use expected proceeds to manufacture upside.

Segment margins are calculated from official Q1 2026 segment Revenue and EBITDA. Parent and transaction interpretations are analyst judgments. Q1 2026 report, FY2025 annual report

Ownership and reporting perimeter

Saudi Aramco holds 70% of SABIC. The model uses the FY2025 continuing-operations perimeter and keeps the announced European Petrochemicals and regional Engineering Thermoplastics divestitures outside recurring forecasts. Consolidated FCFF includes controlled operations, so non-controlling interests are deducted in the equity-value bridge.

The perimeter treatment is a modelling decision anchored to official discontinued-operation disclosures. Q1 2026 report, FY2025 annual report

Q1 2026 segment economics

SegmentRevenueShareEBITDAEBITDA marginEBIT
PetrochemicalsSAR 21.76bn83.2%SAR 2.36bn10.9%SAR 0.10bn
Agri-NutrientsSAR 2.71bn10.4%SAR 1.37bn50.7%SAR 1.17bn
SpecialtiesSAR 1.68bn6.4%SAR 0.44bn26.4%SAR 0.25bn
Petrochemicals21.8Agri-Nutrients2.7Specialties1.7

Revenue and EBITDA by current reportable segment; corporate and eliminations are shown in the source statements but excluded from the revenue-share denominator. Q1 2026 report

Product and earnings map

SegmentRepresentative product familiesPrimary earnings variablesPublic-data boundary
PetrochemicalsPolyethylene, polypropylene, glycols, methanol, MTBE and base chemicalsVolume, product price/mix, feedstock, utilization and freightNo complete product-level volume, realization or margin series
Agri-NutrientsAmmonia and ureaNitrogen prices, gas/feedstock economics and utilizationConsolidated segment is available; full customer-contract economics are private
SpecialtiesPolycarbonate and engineering thermoplasticsMix, differentiated pricing and project rampRegional ETP divestiture changes perimeter comparability

FY2025 annual report, Q1 2026 report

4

Segments, Capacity and Project Pipeline

Capacity only creates value when commissioning, utilization and product realization arrive together.

Polymer applications include pipes and large-scale infrastructure systems.Agri-nutrients exposure connects the portfolio to food security and farm economics.
Figure 2. Polymer applications include pipes and large-scale infrastructure systems. Agri-nutrients exposure connects the portfolio to food security and farm economics. SABIC Integrated Annual Report 2025 (pp. 50, 54)

Segment outlook and the economics of announced capacity

Petrochemicals remains the dominant valuation driver because of its scale, even though current margins are below those of Agri-Nutrients and Specialties. Our FY2026 allocation assumes Petrochemicals grows one percentage point below the company rate, reflecting weak price/mix and the time required for new capacity to contribute. From FY2027 the segment receives a modest positive spread as Fujian ramps, but we do not assume that nameplate capacity translates directly into sales. Product qualification, operating rates, regional demand and realized spreads remain separate constraints.

Agri-Nutrients is the portfolio's principal earnings stabilizer at the Q1 2026 cut. The disclosed segment margin is materially above the group average, so nitrogen prices, gas economics and plant availability can influence consolidated EBITDA more than the segment's Revenue share suggests. The potential urea expansion from approximately 4.8 million tonnes to 7.4 million tonnes is not treated as committed base-case production. Feedstock allocation has been disclosed, but final investment, construction and commercial timing remain necessary gates.

Specialties offers differentiated applications and higher margins than commodity Petrochemicals, but the business is also affected by perimeter change. The Fujian Engineering Thermoplastics compounding plant is scheduled for mechanical completion by the end of Q3 2027, while regional ETP divestitures affect historical comparability. We therefore model Specialties as a bounded mix benefit rather than a source of unquantified premium growth.

The project ledger separates four states: construction, commissioning, ramp-up and steady state. The 1.8 million tonne Fujian ethylene complex is the largest disclosed capacity item and was reported as 98% complete, but our base forecast assigns only a small FY2026 contribution. The Petrokemya MTBE plant has started up and can support current output; the Ibn Zahr recovery system is already commissioned. Later projects, including the ethylene oxide catalyst plant, remain capex and execution items until operating evidence becomes available.

This discipline prevents a common sell-side error: adding announced capacity to Revenue while leaving capex, working capital, utilization and price pressure unchanged. In our model, capacity creates value only when saleable volume earns a return above the cost of capital after the cash required to bring it onstream.

Capacity figures quantify disclosed nameplate or incremental potential only. They are not summed into a company production forecast. SABIC strategic projects, FY2025 annual report, Q1 2026 earnings release

Project and capacity ledger

Asset or projectLocationProductsDisclosed capacityStatusExpected milestoneEvidence
SABIC Fujian Petrochemical ComplexGulei Industrial Park, Fujian, Chinaethylene, ethylene glycol, polyethylene, polypropylene, polycarbonate1.8 million tonnes per year (ethylene)Construction 98% completeH2 2026Official source
Petrokemya MTBE PlantSaudi ArabiaMTBE1.0 million tonnes per year (MTBE)Started upOct 2025Official source
Ibn Zahr Low Temperature Recovery SystemSaudi ArabiaC3 recovery, C4 recovery, MTBE50,000 tonnes per year (MTBE-equivalent)CommissionedH1 2025Official source
Petrokemya Ethylene Oxide Catalyst PlantSaudi Arabiaethylene oxide catalystNot disclosedIn executionDec 2027Official source
Fujian Engineering Thermoplastics Compounding PlantZhangzhou, Fujian, ChinaLEXAN polycarbonate, CYCOLOY PC/ABS blendsNot disclosedIn executionQ3 2027Official source
SABIC Agri-Nutrients Urea Expansion OptionSaudi Arabiaurea2.6 million tonnes per year (incremental potential)Feedstock allocation approved; final capacity not disclosedNot disclosedOfficial source

Only explicitly disclosed capacities are quantified. Status descriptions follow the latest cited public disclosure. FY2025 strategic projects

Disclosed incremental or project capacity

SABIC Fujian Petrochemical Complex1.80mPetrokemya MTBE Plant1.00mIbn Zahr Low Temperature Recovery System0.05mSABIC Agri-Nutrients Urea Expansion Option2.60m

Tonnes per year are not additive across unlike products. The chart compares disclosed figures, not total company capacity. FY2025 strategic projects

How projects enter the forecast

StageFinancial treatmentWhat would change the assumption
ConstructionCapex only; no production revenueUpdated completion percentage or capex guidance
CommissioningWorking capital and start-up cost; minimal saleable outputOfficial start-up confirmation
Ramp-upBounded project-ramp Revenue contributionUtilization or production disclosure
Steady stateNormal segment volume and margin assumptionsSustained operating-rate evidence
5

Industry Structure and Product Cycle

Prices, operating rates and product spreads transmit the global chemical cycle into earnings.

Technical selling and customer qualification support commercialization across end markets.
Figure 3. Technical selling and customer qualification support commercialization across end markets. SABIC Integrated Annual Report 2025 (pp. 56)

Where we are in the cycle and what would confirm a turn

Chemical earnings are governed by an interaction between demand, industry capacity and the marginal producer's cost. When demand grows faster than effective supply, operating rates rise and producers gain pricing power. When new capacity arrives into weak demand, producers compete on price to keep plants loaded, compressing spreads even if reported volumes remain resilient. This is why a volume increase is not automatically bullish for SABIC; the quality of volume depends on realized price/mix and the contribution margin earned on incremental tonnes.

The publicly available market series in this report are directional indicators, not estimates of SABIC's realized prices. US plastics and chemical producer-price indexes, energy benchmarks and fertilizer indexes help identify broad cycle direction, but they do not reproduce Middle East contract terms, product grades, freight or regional discounts. We use them to challenge management commentary and forecast direction, never as a direct replacement for company price/mix disclosure.

Our FY2026 base case assumes the cycle remains difficult. Revenue falls 4.0%, with positive volume and project ramp more than offset by negative price/mix. A genuine turn would require at least two forms of evidence: improving external price indicators and a company-reported price/mix bridge that is no longer deteriorating. Margin confirmation is equally important because a price increase can be consumed by feedstock, energy, freight or under-absorption.

The bull case assumes faster stabilization and higher operating leverage, while the bear case assumes weak price/mix persists and project contributions arrive more slowly. We do not assign a probability-weighted target because the historical dataset is too small to estimate regime probabilities reliably. The scenario range is instead used to show how much of the valuation depends on a cyclical recovery that has not yet been fully observed.

Market proxies are cross-checks. They are not SABIC product realizations or licensed physical petrochemical assessments. FRED commodity and producer-price series, FY2025 annual report

Industry-cycle transmission

External driverTransmission pathSABIC metricCurrent use
Industrial demandEnd-market demand -> product balance -> price and volumeRevenue and utilizationScenario assumption
New global capacitySupply growth -> operating rates -> spreadsPrice/mix and EBITDA marginRisk and sensitivity
Oil and naphthaMarginal producer cost and liquid-feedstock economicsPetrochemical spreadDirectional proxy
Natural gasGas-based producer costFeedstock and fertilizer marginDirectional proxy
China demand and supplyRegional balance, imports and project rampAsia revenue and realized mixQualitative risk

Cycle proxies, indexed to 100

Energy and chemical cycle proxies42.9100.7158.5216.3274.120192020202120222023202420252026BrentHenry HubPetrochemical PPIResins PPI

Each series is rebased to 100 in the first common year. These are directional proxies, not SABIC realized prices. FRED

Selected public market proxies

SeriesLatest annual periodAnnual averageEvidence role
DCOILBRENTEU202690.23Cycle proxy; not company realization
DHHNGSP20263.77Cycle proxy; not company realization
PCU3251103251102026173.74Cycle proxy; not company realization
PCU3252113252112026333.78Cycle proxy; not company realization
PCU325311325311A2026156.11Cycle proxy; not company realization

FRED

Limits of public price proxies

Brent, Henry Hub and broad producer-price indexes do not replace physical Middle East PE, PP, MEG, methanol, MTBE, ammonia or urea assessments. They omit grade, location, contract, freight and customer-mix effects. The report therefore uses them for cycle direction and scenario calibration, not as manufactured product realizations.

6

Feedstock, Cost Curve and Competitive Position

The margin framework separates selling-price movement from feedstock, utilities and operating leverage.

Operating reliability, yield and plant utilization are core earnings variables.
Figure 4. Operating reliability, yield and plant utilization are core earnings variables. SABIC Integrated Annual Report 2025 (pp. 57)

Cost advantage is real, but not uniform across the portfolio

SABIC's Saudi production base can benefit from gas-based feedstock and integration, but a consolidated margin forecast cannot assume that every asset shares the same cost curve. Overseas crackers, specialty operations, joint ventures and product chains may be exposed to different feedstocks, utilities, freight and transfer-pricing arrangements. The public record does not provide a complete plant-by-plant cash-cost database, so we model cost advantage through observed segment margins and explicit margin scenarios rather than a fabricated global ranking.

Feedstock affects earnings through more than the purchase price of hydrocarbons. Yield, energy intensity, co-product credits, operating rate and logistics determine the cash conversion spread. A producer can have advantaged feedstock but still report weak EBITDA if product prices fall faster than input costs or if utilization is too low to absorb fixed conversion expense. Conversely, a tightening product market can expand margins before feedstock prices change materially.

Our base case moves adjusted EBITDA margin from 15.3% in FY2025 to 15.6% in FY2026, then gradually to 18.2% by FY2030. The progression reflects a mix of price normalization, project ramp and recurring transformation savings; it is not attributed entirely to feedstock. A 150 bp shortfall across the explicit forecast reduces DCF value by roughly 16%, making segment margin the most important quarterly validation metric after price/mix.

The mitigation case is therefore conditional. Domestic integration and transformation initiatives can cushion pressure, but they do not immunize the group from global oversupply or less advantaged overseas assets. We would raise normalized margins only after savings recur in segment results or operating disclosures show a durable improvement in conversion economics.

No private feedstock contract or plant-level cash-cost term is inferred. Margin sensitivities show the valuation consequence of this uncertainty. FY2025 annual report, Saudi Aramco investor disclosures

Feedstock and cost map

InputOperational relevanceObservable proxyUnobservable component
Methane and ethaneSaudi gas-based chemicals and derivativesGas policy and broad gas benchmarksPlant contract and transfer price
Propane and butaneOlefin and derivative economicsLPG/oil directionExact conversion yield and plant slate
Light naphthaLiquid-feedstock and marginal-cost exposureBrent and naphtha-linked directionLocation differential and procurement terms
Utilities and freightConversion and delivered costEnergy/freight indicatorsPlant and customer route economics
Transformation savingsFixed and variable conversion costCompany-disclosed recurring savingsUnpublished site-level allocation

Official disclosures identify feedstock families; private contract economics remain unknown. Q1 2026 report, FY2025 annual report

Spread framework

Product spread = benchmark product price
               - feedstock conversion factor x feedstock benchmark
               - variable conversion and logistics cost

SABIC EBITDA = realized volume x realized spread
             - fixed cost + transformation savings +/- mix

The current model does not populate product-level spreads because consistent public benchmark coverage and SABIC realization data are incomplete. The formula remains the target architecture and the uncertainty is handled through price/mix and margin scenarios.

Cost-position interpretation

SABIC may retain a structural feedstock advantage in selected Saudi assets, but that statement cannot be converted into one universal margin assumption. Overseas assets, liquid feedstocks, freight, utilities and product mix produce different economics. The report therefore models consolidated margin ranges and requires segment evidence before making a stronger cost-curve claim.

7

Geographies and End Markets

Revenue is diversified by geography, while customer concentration and private contract terms remain bounded unknowns.

Specialty polymers serve electrical, electronics and power-transmission applications.Material demand is linked to vehicle electrification and lightweighting.
Figure 5. Specialty polymers serve electrical, electronics and power-transmission applications. Material demand is linked to vehicle electrification and lightweighting. SABIC Integrated Annual Report 2025 (pp. 51, 52)

Revenue diversification does not eliminate common-cycle exposure

Q1 2026 Revenue by customer location is geographically broad: Rest of Asia contributed 25.1%, China 18.9%, Saudi Arabia 16.1%, the Americas 13.3%, Europe 9.2%, Africa 8.5% and Other markets 8.9%. This reduces dependence on a single country, but it should not be mistaken for economic independence. Many end markets share exposure to global manufacturing, construction, packaging, automotive, electronics and agricultural cycles.

Asia is the most important demand region in the disclosed mix, and China is also central to the Fujian growth plan. This creates both strategic proximity and execution concentration. Local production can improve market access and logistics, yet the value of new output still depends on Chinese demand, regional capacity additions and product spreads. A weak regional balance can offset the advantages of being closer to customers.

Currency exposure is similarly layered. The reporting currency is the Saudi riyal, but sales, feedstock, freight and overseas costs can reference different currencies or dollar-linked prices. Public geographic Revenue does not provide a complete transactional FX map. We therefore retain FX and freight in the scenario range instead of presenting a false hedge ratio.

For monitoring purposes, customer-location Revenue is more useful than legal-entity domicile because it indicates where demand is realized. It still cannot answer customer concentration, contract duration or product-level profitability. Those remain explicit data gaps rather than silently diversified assumptions.

Geographic shares use official Q1 2026 customer-location Revenue and sum to the reported total subject to rounding. Q1 2026 report

Q1 2026 revenue by customer location

GeographyRevenueShare
Rest of AsiaSAR 6.56bn25.1%
ChinaSAR 4.94bn18.9%
Saudi ArabiaSAR 4.21bn16.1%
AmericasSAR 3.49bn13.3%
EuropeSAR 2.41bn9.2%
OtherSAR 2.33bn8.9%
AfricaSAR 2.21bn8.5%
Rest of Asia6.6China4.9Saudi Arabia4.2Americas3.5Europe2.4Other2.3Africa2.2

Geography is based on customer location, not plant location or legal-entity domicile. Q1 2026 report

Geographic concentration

Asia excluding China is the largest disclosed customer-location region at 25.1% of Q1 Revenue. China and Saudi Arabia remain separately material. The mix links SABIC to Asian industrial demand, regional supply additions, trade flows and freight, but it does not reveal product profitability by country.

Customer-data boundary

Public reporting supports Revenue by customer location and, where disclosed, customer categories. It does not provide a complete named-customer roster, contract duration, customer-level pricing or product margin. Those remain explicit unknowns rather than inferred customer relationships.

8

Historical Financial and Normalization Review

Reported history is normalized for discontinued operations and exceptional items before it informs the forecast.

What the historical record says about earnings quality

FY2025 continuing Revenue was SAR 116.53bn, only about 1% below the restated FY2024 level, but adjusted EBITDA declined from SAR 20.98bn to SAR 17.88bn and EBIT fell from SAR 9.43bn to SAR 4.37bn. The divergence shows that the principal problem was not simply lost volume. Price/mix, spread compression, cost absorption and depreciation reduced the earnings generated from a broadly similar Revenue base.

Adjusted net income from continuing operations fell from SAR 5.88bn to SAR 2.07bn. Reported net income attributable to the parent was a SAR 25.78bn loss, dominated by discontinued operations and exceptional accounting rather than recurring earning power. For that reason, the forward model uses adjusted EPS for continuing operations and does not forecast reported EPS until disposal charges, retained liabilities and other special items can be bounded.

Cash generation was stronger than reported earnings in FY2025. Pro forma continuing operating cash flow was SAR 16.54bn and free cash flow was SAR 9.21bn, against reported capex of SAR 8.77bn. That evidence supports the view that the balance sheet can absorb a difficult operating year, but it does not establish a permanently covered dividend. FY2025 dividends per share were SAR 3.00 and the company page identifies payout above 100%.

Q1 2026 reinforces the need to separate earnings from cash. Revenue was SAR 26.15bn, adjusted EBITDA SAR 4.15bn and adjusted net income attributable to the parent SAR 0.82bn, while free cash flow was negative SAR 0.27bn and net debt was SAR 2.77bn. One quarter should not be annualized mechanically, but the cash result is an early warning that working capital and capex can delay conversion even when adjusted earnings remain positive.

Historical comparisons are perimeter-aware. FY2024 and FY2025 official continuing figures are retained together, while older third-party history remains a separate analytical series. We do not splice them into a smooth trend because doing so would create artificial growth and margin signals from accounting-perimeter changes.

All cited FY2024-FY2025 values use the company's continuing-operation presentation. Q1 2026 cash flow is reported, not seasonally normalized. FY2025 annual report, Q1 2026 earnings release, SABIC dividends

Reported consolidated history

YearRevenueEBITDAMarginReported net incomeOperating cash flowCapexFree cash flow
2020SAR 116.95bnSAR 20.51bn17.5%SAR 0.07bnSAR 22.15bnSAR 13.26bnSAR 8.89bn
2021SAR 174.88bnSAR 48.51bn27.7%SAR 23.07bnSAR 39.49bnSAR 10.97bnSAR 28.52bn
2022SAR 183.08bnSAR 36.40bn19.9%SAR 16.53bnSAR 35.81bnSAR 10.22bnSAR 25.59bn
2023SAR 141.54bnSAR 19.02bn13.4%SAR -2.77bnSAR 24.45bnSAR 10.49bnSAR 13.96bn
2024SAR 139.98bnSAR 19.47bn13.9%SAR 1.54bnSAR 16.36bnSAR 10.20bnSAR 6.16bn

FY2020-FY2024 figures use the historical reported perimeter and are not spliced into the current continuing perimeter. FY2024 annual report

Revenue and EBITDA cycle

Reported Revenue and EBITDA-0.7bn50.2bn101.0bn151.9bn202.8bn20202021202220232024RevenueEBITDA

FY2024 annual report

Cash conversion and reinvestment

Reported cash flow and capital expenditure202022.1bn13.3bn8.9bn202139.5bn11.0bn28.5bn202235.8bn10.2bn25.6bn202324.4bn10.5bn14.0bn202416.4bn10.2bn6.2bnOperating cash flowCapexFree cash flow

FY2024 annual report

Current continuing-perimeter bridge

YearRevenueAdjusted EBITDAAdjusted net incomeReported net incomeAdjusted EPS
2024SAR 117.74bnSAR 20.98bnSAR 5.88bnSAR 1.54bnSAR 1.96
2025SAR 116.53bnSAR 17.88bnSAR 2.07bnSAR -25.78bnSAR 0.69

Adjusted and reported earnings remain separate. FY2025 reported loss includes discontinued operations and other non-recurring effects. FY2025 annual report

Normalization policy

Normalized earnings remove specifically identified discontinued-operation, impairment, restructuring, remeasurement and disposal effects only when evidence supports the adjustment. The IFRS result is always retained. Reported EPS is not forecast by forcing an assumed exceptional-item reversal.

9

Forecast Framework and Assumptions

The selected forecast is a transparent driver bridge, cross-checked against simpler statistical benchmarks.

Materials-science capability supports higher-value product development.
Figure 6. Materials-science capability supports higher-value product development. SABIC Integrated Annual Report 2025 (pp. 62)

From operating assumptions to Revenue and adjusted EPS

The house forecast is a driver bridge rather than a time-series extrapolation. Annual Revenue is built from separately visible assumptions for volume, product price/mix, project ramp and reporting perimeter. This matters for a cyclical producer because identical Revenue growth can have very different quality. Volume gained through new low-margin capacity is not equivalent to price-led growth from tighter product markets.

FY2026 Revenue declines 4.0% to SAR 111.87bn. Positive 1.5% volume growth and a 0.5% project contribution are more than offset by negative 6.0% price/mix. FY2027 Revenue then rises 7.5% to SAR 120.26bn as price/mix turns positive and the Fujian ramp contributes 3.5%. Growth moderates to 6.0%, 4.5% and 4.0% in FY2028-FY2030 as the explicit project contribution fades.

Adjusted EBITDA is calculated from Revenue and a normalized margin path. The base margin improves by only 20 bps in FY2026, then by 150 bps versus the FY2025 reference in FY2027 and 290 bps by FY2030. The progression captures operating leverage and recurring savings, but it remains below an assumption of immediate full-cycle normalization. Segment Revenue is allocated from the company total using Q1 2026 mix and bounded growth spreads, then reconciled back to the consolidated forecast.

The EPS bridge begins with adjusted EBITDA, subtracts depreciation and amortization to derive EBIT, then incorporates finance and associate income, tax and non-controlling interests. Dividing adjusted net income attributable to the parent by 3.0bn shares produces adjusted EPS. Reported EPS is intentionally excluded because discontinued-operation and exceptional-item accounting cannot be forecast defensibly from current public information.

FCFF is derived from after-tax EBIT plus depreciation and amortization, less capex and working capital. The integrated statement model separately tracks cash, debt, receivables, inventory, payables, PP&E, non-controlling interests and parent equity. A disclosed other-assets bucket balances the selected statements; it is shown explicitly because public data does not support a precise forecast of every asset line.

Model selection remains conservative. The post-Q1 seasonal benchmark has the lowest observed Revenue WAPE at 10.1%, but only five eligible periods. The structural driver model is used as the primary analyst case because it can represent disclosed projects and perimeter changes, not because it has proven statistical superiority. Prior-year and consensus benchmarks remain visible calibration anchors.

Forecast assumptions are house estimates. Equations and source-derived starting values are reconciled to the cited official filings. FY2025 annual report, Q1 2026 report

Revenue and earnings identities

Revenue[t] = Revenue[t-1] x (1 + volume + price/mix + project ramp + perimeter)

Adjusted EBITDA = Revenue x normalized EBITDA margin
EBIT = Adjusted EBITDA - depreciation and amortization
Adjusted net income = EBIT + finance/associate bridge - tax - NCI
Adjusted EPS = adjusted net income / 3.0bn shares
FCFF = EBIT x (1-tax) + D&A - capex - change in working capital

FY2026 Revenue driver bridge

ScenarioVolumePrice/mixProject rampPerimeterTotal growthRevenue
Bear-1.0%-9.0%0.2%0.0%-9.8%SAR 105.11bn
Base1.5%-6.0%0.5%0.0%-4.0%SAR 111.87bn
Bull3.0%-3.0%1.0%0.0%1.0%SAR 117.70bn
Base-case FY2026 growth contributionVolume1.5pptPrice/mix-6.0pptProject ramp0.5pptPerimeter0.0ppt

Q1 2026 release, FY2025 annual report

FY2026 Revenue model comparison

ModelForecastRoleMethodDecision
q1 simple annualizedSAR 104.61bnmechanical controlQ1 actual multiplied by fourNot selected as the primary house forecast.
q1 seasonal shareSAR 104.13bnstatistical challengerQ1 actual divided by historical median Q1/FY shareNot selected as the primary house forecast.
sell side driver modelSAR 111.87bnselected primaryvolume + price/mix + project ramp + perimeter bridgePrimary because it can represent disclosed project, mix and perimeter changes; controls remain visible for calibration.
current consensusSAR 110.98bnexternal cross checkcurrent FMP consensus; not a historical archiveNot selected as the primary house forecast.
q1 simple annualized104.6q1 seasonal share104.1sell side driver model111.9current consensus111.0

The structural model is selected because it represents disclosed changes. Q1 seasonality and consensus remain visible calibration anchors, not hidden inputs.

Forecast selection and calibration

Forecast approaches are compared only at like information horizons. The post-Q1 seasonal model has the lowest observed Revenue WAPE, but only five comparable periods. The structural driver model cannot be promoted solely from that evidence because its historical assumptions cannot be reconstructed consistently. We therefore use it as an explicit analyst forecast, with simpler statistical benchmarks retained as calibration checks.

10

Forecast Financial Statements

Segment estimates reconcile to consolidated income, cash flow and balance-sheet outputs.

Process and application innovation can improve product mix and customer retention.
Figure 7. Process and application innovation can improve product mix and customer retention. SABIC Integrated Annual Report 2025 (pp. 59)

Earnings recover before dividend coverage fully normalizes

The base case produces a staged recovery rather than a straight-line rebound. Revenue remains below the FY2025 level in FY2026, while adjusted EBITDA holds near SAR 17.40bn because margin improves slightly. Adjusted EPS rises to SAR 1.23 as the continuing-operation bridge normalizes, but the modeled SAR 3.00 dividend remains substantially above earnings per share. This is a liquidity-supported distribution, not an earnings-covered payout.

FY2027 is the first year in which the operating thesis becomes visible across all three statements. Revenue reaches SAR 120.26bn, adjusted EBITDA SAR 20.26bn and adjusted EPS SAR 1.87. FCFF rises to SAR 7.78bn before financing and distributions, while the selected cash-flow statement shows levered free cash flow of SAR 5.78bn after cash interest. The difference between these measures is preserved because enterprise valuation uses FCFF, whereas dividend capacity depends on cash available to equity and balance-sheet liquidity.

By FY2030, Revenue reaches SAR 138.54bn, adjusted EBITDA margin 18.2%, adjusted EPS SAR 2.94 and FCFF SAR 12.58bn. The path requires margin recovery, project execution and controlled reinvestment. It does not require a return to an exceptional commodity peak, but it does assume that current weakness is not permanent.

The balance sheet absorbs the dividend shortfall in the early years. Under the selected statement path, cash and short-term investments decline as distributions exceed levered free cash flow and no new debt is assumed. This is not a forecast of distress; starting liquidity is material. It is nevertheless a reason not to value the dividend independently of capex and working-capital requirements.

Forecast precision should be interpreted correctly. The displayed values are point estimates generated by a transparent set of assumptions, not statistical certainties. The scenario and risk sections show the range created by alternative operating paths, while the quarterly monitoring framework identifies which assumption should change when new evidence arrives.

FCFF and levered free cash flow serve different purposes and are not interchangeable. Forecasts are analyst estimates. FY2025 annual report

Base-case income and cash-flow forecast

YearRevenueAdj. EBITDAMarginEBITAdj. net incomeAdj. EPSFCFFDPS
2026SAR 111.87bnSAR 17.40bn15.6%SAR 7.10bnSAR 3.68bnSAR 1.23SAR 5.97bnSAR 3.00
2027SAR 120.26bnSAR 20.26bn16.8%SAR 9.44bnSAR 5.61bnSAR 1.87SAR 7.78bnSAR 3.00
2028SAR 127.47bnSAR 22.24bn17.4%SAR 11.03bnSAR 6.86bnSAR 2.29SAR 9.64bnSAR 3.20
2029SAR 133.21bnSAR 23.78bn17.8%SAR 12.32bnSAR 7.88bnSAR 2.63SAR 11.31bnSAR 3.40
2030SAR 138.54bnSAR 25.28bn18.2%SAR 13.51bnSAR 8.81bnSAR 2.94SAR 12.58bnSAR 3.60

Revenue, EBITDA and free-cash-flow trajectory

Base-case forecast trajectory-9.9bn31.2bn72.3bn113.4bn154.4bn20262027202820292030RevenueAdjusted EBITDAFCFF

Segment forecast and reconciliation

SegmentFY2026 RevenueFY2026 marginFY2030 RevenueFY2030 margin
PetrochemicalsSAR 93.24bn10.5%SAR 116.08bn13.2%
Agri-NutrientsSAR 12.20bn50.4%SAR 14.56bn53.1%
SpecialtiesSAR 6.43bn26.1%SAR 7.89bn28.8%
Segment RevenuePetrochemicals93.2bn116.1bnAgri-Nutrients12.2bn14.6bnSpecialties6.4bn7.9bnFY2026FY2030

Segment values reconcile exactly to consolidated Revenue and EBITDA. They are allocated from disclosed mix and bounded growth spreads, not product-level realizations.

Integrated cash flow and balance sheet

YearCFOCapexFCFLiquidityDebtNet debtParent equityBalance check
2026SAR 13.47bnSAR 9.50bnSAR 3.97bnSAR 34.14bnSAR 37.06bnSAR 2.92bnSAR 123.40bnSAR 0.00bn
2027SAR 15.78bnSAR 10.00bnSAR 5.78bnSAR 29.41bnSAR 37.06bnSAR 7.64bnSAR 120.01bnSAR 0.00bn
2028SAR 17.44bnSAR 9.80bnSAR 7.64bnSAR 25.95bnSAR 37.06bnSAR 11.10bnSAR 117.28bnSAR 0.00bn
2029SAR 18.81bnSAR 9.50bnSAR 9.31bnSAR 23.57bnSAR 37.06bnSAR 13.49bnSAR 114.95bnSAR 0.00bn
2030SAR 20.08bnSAR 9.50bnSAR 10.58bnSAR 21.85bnSAR 37.06bnSAR 15.21bnSAR 112.96bnSAR 0.00bn

The selected balance sheet discloses other assets as a balancing bucket; it does not claim unavailable line-item precision.

11

Valuation and Recommendation

FCFF DCF is the primary method; market-implied growth, dividends and reviewed peers are cross-checks.

Valuation: central value is close to market, but model risk is wide

FCFF DCF is the primary method because SABIC is capital intensive and the forecast explicitly models reinvestment. The base case discounts FY2026-FY2030 FCFF at an 8.5% WACC using mid-year convention and capitalizes FY2030 cash flow at 2.5% terminal growth. Consolidated enterprise value is adjusted for SAR 2.77bn net debt and SAR 25.13bn of non-controlling interests. The resulting equity value is SAR 52.90 per share.

The conclusion is deliberately less confident than the central number appears. Terminal value contributes 79.8% of enterprise value, meaning most of the DCF depends on cash flows outside the explicit forecast. A 100 bp increase in WACC reduces value to approximately SAR 43.78, while a 50 bp reduction in terminal growth lowers it to roughly SAR 48.86. These are model sensitivities, not probabilities, but they show that small long-term changes matter more than the 1.3% base-case price upside.

The dividend discount model produces SAR 47.94 and is used only as a cross-check. A dividend method can understate operating value during an investment phase or overstate equity support when distributions are funded from liquidity rather than recurring free cash flow. The reverse DCF indicates that the reference price embeds about 2.4% perpetual FCFF growth at the base WACC, close to our 2.5% assumption. The market and our central case are therefore expressing broadly similar long-run expectations.

Peer multiples are contextual rather than determinative. The reviewed companies differ by geography, feedstock, product mix, ownership and cycle position. Several peers are near trough earnings, making EV/EBITDA mechanically high and P/E not meaningful. Applying a median multiple without normalizing those differences would create false precision.

The bear value of SAR 15.67 and bull value of SAR 99.86 are intentionally wide because operating assumptions, WACC and terminal growth move together. We do not average them into a target price. The base value remains the reference, while the risk sensitivities show which individual assumptions create the largest downside.

Valuation outputs are deterministic results of disclosed assumptions. They are not confidence intervals or guarantees of investment performance. Q1 2026 earnings release, FMP key metrics methodology

FCFF DCF scenarios

ScenarioWACCTerminal growthPV explicit FCFFPV terminal valueTerminal shareValue/shareTotal returnIndication
Base8.5%2.5%SAR 37.70bnSAR 148.90bn79.8%SAR 52.907.1%Hold
Bear9.2%2.0%SAR 17.41bnSAR 57.51bn76.8%SAR 15.67-65.2%Sell
Bull7.8%3.0%SAR 52.12bnSAR 275.35bn84.1%SAR 99.8697.0%Buy

Mid-year discounting. Consolidated enterprise value is adjusted for net debt and non-controlling interests.

Cost of capital

InputValueRole
Risk-free rate4.5%Saudi-riyal long-duration reference assumption
Equity risk premium5.5%Mature-market equity risk
Levered beta0.80Cyclical equity sensitivity
Country adjustment0.6%Applicable country-risk allowance
Cost of equity9.5%Rf + beta x ERP + country adjustment
Pre-tax cost of debt5.3%Marginal borrowing assumption
After-tax cost of debt4.2%Debt cost x (1-tax)
Base WACC8.5%Rounded model discount rate

Valuation cross-checks

MethodValue/shareDifference to marketKey diagnosticUse
two stage dividend discount cross checkSAR 47.94-8.2%cost of equity: 9.5%cross check not primary
reverse fcff dcf market implied terminal growthSAR 52.200.0%market implied terminal growth: 2.4%diagnostic
primary fcff dcf referenceSAR 52.901.3%wacc: 8.5%primary
Cross-check values versus the reference priceSAR 39SAR 45SAR 50SAR 56SAR 61Market SAR 52.20Dividend discountSAR 47.94Market-implied FCFFSAR 52.20Primary FCFF DCFSAR 52.90

Market price implies 2.42% perpetual FCFF growth at the base WACC. DDM is a cross-check, not the target-price method.

DCF sensitivity to WACC and terminal growth

WACC / g1.5%2.0%2.5%3.0%3.5%
7.5%SAR 54.82SAR 59.76SAR 65.68SAR 72.91SAR 81.96
8.0%SAR 49.74SAR 53.85SAR 58.70SAR 64.53SAR 71.65
8.5%SAR 45.39SAR 48.86SAR 52.90SAR 57.67SAR 63.40
9.0%SAR 41.62SAR 44.58SAR 47.99SAR 51.96SAR 56.66
9.5%SAR 38.33SAR 40.87SAR 43.78SAR 47.13SAR 51.05

SAR per share. The broad range is a model-risk signal, not a confidence interval.

Reviewed peer valuation context

CompanyRoleEV/SalesEV/EBITDAP/EEBITDA marginLimitation
Dow Inc. (DOW)commodity chemicals cross check1.0x44.9xn/m2.1%Different geography, feedstock position, portfolio and accounting perimeter.
LyondellBasell Industries N.V. (LYB)polyolefins and intermediates cross check1.1x23.9xn/m4.4%Different regional asset base, refinery exposure and shareholder structure.
BASF SE (BAS.DE)diversified chemicals cross check1.0x8.3x24.5x12.0%Broader portfolio and European cost exposure reduce direct comparability.
Covestro AG (1COV.DE)performance materials cross check1.2x20.4xn/m5.7%Narrower product mix and different ownership and transaction context.
Nutrien Ltd. (NTR)agri nutrients cross check1.6x7.2x13.6x22.7%Potash, retail and North American exposure make it unsuitable as a consolidated SABIC peer.
Yara International ASA (YAR.OL)nitrogen fertilizer cross check0.9x4.6x8.3x19.8%Different gas sourcing, regional footprint and consolidated product mix.

Several chemical peers are near cyclical trough earnings, making EV/EBITDA unstable. No peer median is mechanically converted into a SABIC target price. FMP key metrics documentation

12

Scenarios, Sensitivities, Catalysts and Risks

The report states what can break the thesis, how it would transmit and where it appears in the model.

How to interpret probability, impact and mitigation

Probability labels are analyst judgments based on current industry and company evidence; they are not frequencies estimated from a large historical sample. Impact labels are tied to deterministic shocks applied to the base DCF: below 5% is Low, 5% to 15% is Moderate and above 15% is High. Each sensitivity changes one defined mechanism while holding other assumptions constant, so it measures exposure rather than a complete alternative scenario.

Mitigation is assessed separately from probability. A company action can reduce the financial consequence of a risk without making the event less likely. The evidence-to-monitor field identifies the disclosure that would confirm, weaken or invalidate our current treatment.

Risk sensitivities are deterministic outputs of the stated one-factor shocks applied to the base-case valuation.

Operating and valuation scenarios

ScenarioFY2026 RevenueFY2026 marginFY2026 EPSFY2026 FCFFDCF/shareTotal return
BearSAR 105.11bn14.5%SAR 0.58SAR 3.10bnSAR 15.67-65.2%
BaseSAR 111.87bn15.6%SAR 1.23SAR 5.97bnSAR 52.907.1%
BullSAR 117.70bn16.4%SAR 1.72SAR 7.82bnSAR 99.8697.0%

Catalysts and confirming evidence

CatalystExpected windowPositive evidenceModel consequence
Fujian commissioning and rampH2 2026 onwardOfficial start-up and utilization progressHigher volume/project-ramp contribution
Chemical pricing stabilizationQuarterlyImproving price/mix and proxy directionRevenue and margin upside
Portfolio transaction completionTransaction-dependentClosing, proceeds and retained-liability disclosureNet debt and reported-EPS bridge
Recurring transformation savingsQuarterly/FYSavings repeat in segment margin and cash conversionHigher normalized EBITDA
Dividend decisionBoard/AGM cyclePayout covered by FCF and liquidityEquity return support

Q1 2026 release, FY2025 annual report

Principal forecast risks

RiskTransmissionAffected outputCurrent mitigation
Global overcapacity and weak demandLower operating rates and spreadsRevenue, EBITDA, DCFBear price/mix and margin path
Project delay or slow rampCapex precedes saleable productionFCF, volume and valuationStage-gated project treatment
Feedstock or utility repricingHigher variable costSegment marginMargin sensitivity; no false contract precision
Portfolio accountingDisposal, impairment and retained liabilityReported EPS and equity bridgeReported EPS left unmodelled
FX, freight and regional tradeRealization and delivered costRevenue/mix and working capitalScenario range
Terminal-value dependenceLong-duration assumptions dominate DCFTarget valueWACC/g matrix and DDM cross-check

Quantified principal risks and mitigation

Probability and valuation-impact classificationMR1OR1OR2FR1FR2VR1VR2TR1LowModerateHighLowModerateHighProbabilityImpact

MR1: Prolonged petrochemical price and demand weakness

High probability · Moderate impact

Mechanism. Lower product realization and operating rates reduce segment Revenue, EBITDA and FCFF.

Valuation impact. Revenue is 5% below the base case in every explicit forecast year, with base margins retained. The DCF declines from SAR 52.90 to SAR 47.73, a 9.8% downside.

Mitigation. Saudi feedstock positioning and portfolio breadth provide partial protection, but neither removes exposure to global spreads.

Evidence to monitor. Quarterly price/mix disclosure, segment EBITDA margins, operating-rate commentary and chemical price proxies.

OR1: Feedstock, utility or conversion-cost squeeze

Moderate probability · High impact

Mechanism. Higher variable cost or weaker spreads reduce EBITDA and post-tax operating cash flow without an offsetting Revenue change.

Valuation impact. Adjusted EBITDA margin is 150 bps below the base case in every explicit year. The DCF declines from SAR 52.90 to SAR 44.28, a 16.3% downside.

Mitigation. Transformation savings, advantaged domestic feedstock and differentiated products can absorb part of the pressure; overseas assets remain less protected.

Evidence to monitor. Segment EBITDA margins, transformation savings, gas and energy proxies, freight and turnaround commentary.

OR2: Fujian commissioning or commercial ramp delay

Moderate probability · Moderate impact

Mechanism. Capital is deployed before saleable output, lowering Revenue and FCFF while the fixed investment remains committed.

Valuation impact. The explicit Fujian project-ramp contribution is removed from FY2026 and FY2027; later base growth resumes from the lower Revenue base. The DCF declines from SAR 52.90 to SAR 49.16, a 7.1% downside.

Mitigation. Our project-ramp framework assigns no production during construction; only disclosed commissioning and ramp milestones unlock Revenue.

Evidence to monitor. Mechanical completion, start-up date, utilization, product qualification and customer-offtake disclosures.

FR1: Project capex inflation

Moderate probability · High impact

Mechanism. Higher reinvestment reduces FCFF and liquidity even if operating earnings are unchanged.

Valuation impact. Capital expenditure is 20% above the base case in every explicit forecast year. The DCF declines from SAR 52.90 to SAR 42.76, a 19.2% downside.

Mitigation. Portfolio sequencing and joint-venture structures can limit consolidated cash exposure, but public project disclosures do not provide complete contractual protection.

Evidence to monitor. Quarterly capex guidance, project completion percentages, committed expenditure and construction-cost updates.

FR2: Working-capital absorption

High probability · Moderate impact

Mechanism. Receivables, inventory or supplier-term pressure converts reported earnings into less cash.

Valuation impact. Annual change in working capital is SAR 1.0bn worse than the base case in every explicit forecast year. The DCF declines from SAR 52.90 to SAR 47.58, a 10.0% downside.

Mitigation. Diversified geographies and customer markets reduce single-counterparty dependence, but private payment terms are not publicly observable.

Evidence to monitor. Receivable days, inventory days, payable days and the quarterly EBITDA-to-CFO conversion bridge.

VR1: Higher discount rate

Moderate probability · High impact

Mechanism. A higher required return reduces the present value of both explicit FCFF and the terminal value.

Valuation impact. WACC increases by 100 bps to 9.5%, with base FCFF and 2.5% terminal growth unchanged. The DCF declines from SAR 52.90 to SAR 43.78, a 17.2% downside.

Mitigation. Low financial leverage helps the cost of capital, but it cannot eliminate duration risk in a DCF where terminal value dominates.

Evidence to monitor. Saudi long-duration rates, equity risk premium, beta, debt spreads and the terminal-value share of enterprise value.

VR2: Lower sustainable terminal growth

Moderate probability · Moderate impact

Mechanism. Lower normalized growth reduces the continuing value assigned beyond FY2030.

Valuation impact. Terminal growth falls 50 bps to 2.0%, with base FCFF and 8.5% WACC unchanged. The DCF declines from SAR 52.90 to SAR 48.86, a 7.6% downside.

Mitigation. We show the full WACC and terminal-growth sensitivity matrix and use DDM and market-implied growth as independent cross-checks.

Evidence to monitor. Long-run nominal GDP and inflation assumptions, reinvestment returns and post-FY2030 capacity economics.

TR1: Divestiture leakage or retained liabilities

Moderate probability · Low impact

Mechanism. Lower net proceeds or retained obligations reduce equity value without changing continuing FCFF.

Valuation impact. SAR 5.0bn of additional retained liabilities is deducted from equity value. The DCF declines from SAR 52.90 to SAR 51.23, a 3.2% downside.

Mitigation. The base forecast excludes transaction proceeds until closing terms are known and keeps reported EPS separate from adjusted EPS.

Evidence to monitor. Closing announcements, cash proceeds, taxes, stranded costs, indemnities and discontinued-operation reconciliation.

Probability is analyst judgment. Impact is the deterministic change to the base FCFF DCF from the stated one-factor shock. FY2025 annual report, Q1 2026 report, Q1 2026 earnings release

Material events and forecast treatment

EventDateFinancial effectForecast treatmentEvidence
Teesside cracker closure included in discontinued operations31 Dec 2025discontinued operations and asset impairmentExcluded from the recurring earnings base; retained in reported EPS reconciliation.Official source
European Petrochemicals and regional Engineering Thermoplastics divestments8 Jan 2026discontinued operations and capital allocationForecast the continuing-operations perimeter only; transaction proceeds remain scenario-dependent until closing.Official source

Project evidence changes the model only at an operating milestone

Construction progress is not Revenue. The Fujian contribution changes when official evidence establishes commissioning, saleable output, utilization or customer qualification. A disclosed delay reduces project-ramp Revenue and FCFF; a generic progress update remains supporting evidence and does not create an automatic forecast revision.

Portfolio announcements remain outside recurring earnings until terms are executable

Divestiture evidence enters the continuing-operation perimeter, proceeds and net-debt bridge, and retained-liability reconciliation only when official terms support the treatment. An announced transaction without closing economics is retained as a scenario item rather than converted into base-case equity value.

Cycle headlines require financial corroboration

Commodity and industry news alters price/mix or margin assumptions only when it is corroborated by company disclosure or a relevant product-market proxy. Article count and sentiment alone are not forecast drivers. The quarterly bridge remains the controlling evidence for realized pricing and operating leverage.

Dividend evidence is tested against cash, not accounting profit alone

A board recommendation is compared with modeled free cash flow, liquidity and committed investment. A distribution funded from existing liquidity can support near-term total return, but it does not demonstrate recurring coverage and should not be capitalized as a permanent earnings stream.

Forecast treatment is analyst judgment applied only to accepted official events; it is not inferred from headline volume. FY2025 annual report, Q1 2026 release

13

Capital Allocation, ESG and Governance

Cash generation is tested against committed investment, dividends, balance-sheet resilience and governance.

Governance and capital allocation remain important given SABIC's project scale and ownership structure.
Figure 8. Governance and capital allocation remain important given SABIC's project scale and ownership structure. SABIC Integrated Annual Report 2025 (pp. 88)

The dividend is supported by liquidity before it is covered by free cash flow

Capital allocation is the point where the recovery thesis becomes an equity thesis. In FY2025 the company disclosed SAR 3.00 per share of dividends and a payout above 100%. Our FY2026 base case retains SAR 3.00, equivalent to SAR 9.0bn for the parent shares, while the integrated statement model produces about SAR 3.97bn of levered free cash flow before parent and non-controlling distributions. The shortfall is funded from liquidity in the model.

This treatment is not a prediction that the dividend must be cut. SABIC begins with substantial cash and low net debt, so a temporary gap can be absorbed. The risk is duration: repeated distributions above recurring cash generation would compete with project capex, reduce financial flexibility or eventually require more debt. Dividend safety therefore depends on the speed of margin recovery and the cash demands of the investment program, not only on accounting earnings.

Our capital hierarchy is maintenance and committed project spending first, balance-sheet resilience second, ordinary dividends third and discretionary growth or transaction deployment thereafter. This is an analytical ordering, not a statement of management policy. The model assumes no debt issuance in the selected path and makes declining liquidity visible rather than using an undisclosed financing plug.

Governance must also be read through the ownership structure. Saudi Aramco's 70% stake aligns SABIC with national industrial strategy and gives the parent decisive voting influence. Minority investors still require transparent related-party economics, disciplined project returns and clear treatment of non-controlling interests. We do not assign a governance premium or discount without transaction-specific evidence.

Sustainability initiatives can affect capex, operating cost, market access and long-run asset competitiveness. They are financially relevant when they change measurable energy intensity, carbon cost, product mix, customer qualification or regulatory exposure. The report does not convert broad sustainability statements into valuation uplift without a cash-flow bridge.

Dividend coverage uses the selected integrated statement model. Governance and capital priorities are analyst interpretations. SABIC dividends, SABIC governance, SABIC sustainability

Capital allocation and dividend capacity

YearFCFParent dividendDividend coverageClosing liquidityNet debt
2026SAR 3.97bnSAR 9.00bn0.44xSAR 34.14bnSAR 2.92bn
2027SAR 5.78bnSAR 9.00bn0.64xSAR 29.41bnSAR 7.64bn
2028SAR 7.64bnSAR 9.60bn0.80xSAR 25.95bnSAR 11.10bn
2029SAR 9.31bnSAR 10.20bn0.91xSAR 23.57bnSAR 13.49bn
2030SAR 10.58bnSAR 10.80bn0.98xSAR 21.85bnSAR 15.21bn
Free cash flow and modeled dividend20264.0bn9.0bn20275.8bn9.0bn20287.6bn9.6bn20299.3bn10.2bn203010.6bn10.8bnFree cash flowParent dividend

The FY2026 base-case dividend exceeds modeled FCF and is funded from liquidity; this is visible rather than hidden in the balance sheet. SABIC dividends

Capital-allocation hierarchy

PriorityModel treatmentEvidence required
Safety and sustaining investmentEmbedded in capexOfficial capex and project disclosures
Committed growth projectsScenario-specific capex and rampMilestones and updated guidance
DividendExplicit DPS and cash-coverage testBoard recommendation and liquidity
Portfolio transactionsNot assumed as recurring FCFFClosing proceeds and retained obligations
Balance-sheet resilienceMinimum liquidity and net-debt roll-forwardOfficial cash and debt

Governance and sustainability evidence

The report uses company policies, the integrated annual report and official regulatory evidence to identify governance, climate, safety and stakeholder risks. It does not convert narrative disclosures into an unsupported proprietary ESG score. Material capex, liabilities, incidents or policy changes should enter the financial model through their affected cash-flow compartment.

FY2025 annual report, SABIC governance, SABIC sustainability

14

Methodology, Diagnostics and Disclosures

Forecast diagnostics, research assumptions, evidence hierarchy and material limitations.

Where analyst judgment remains material

The strongest public evidence covers consolidated financial statements, current segment results, disclosed projects, geographic Revenue and selected operating metrics. Product-level realizations, plant utilization, customer contracts, private feedstock terms, transaction liabilities and historical point-in-time consensus are less transparent. Where evidence is unavailable, the report states the limitation rather than replacing it with an unsupported estimate.

Material analyst judgments include the pace of price/mix normalization, project-ramp timing, margin recovery, long-run capex, working capital, WACC and terminal growth. Each is disclosed through assumptions or sensitivities. Probability labels in the risk section are qualitative judgments; valuation impacts are deterministic calculations from the stated scenarios.

Forecast and valuation conclusions should be revised only when the underlying evidence or assumption changes. Any change to the target value, indicative rating or material risk classification should be accompanied by a consistent update to the affected financial statements, valuation bridge and disclosure.

Historical model diagnostics

The lowest observed Revenue WAPE is 10.1% for the post-Q1 seasonal model across 5 periods. It is not directly comparable with prior-year-origin controls and is not treated as proof of future accuracy.

MetricApproachScopeObs.MAERMSEBiasWAPEMedian APEDirection
Reported EPSPrior-year actualPrior-year11SAR 2.61SAR 3.61SAR 0.7257.9%39.5%0.0%
Reported EPSThree-year medianPrior-year11SAR 3.40SAR 4.07SAR 1.4475.4%68.6%45.5%
RevenueLagged-driver ridgePrior-year8SAR 35.09bnSAR 40.39bnSAR 5.09bn23.2%20.4%37.5%
RevenuePrior-year actualPrior-year11SAR 21.23bnSAR 28.20bnSAR 4.46bn13.8%11.4%0.0%
RevenueQ1 seasonal sharePost-Q15SAR 15.33bnSAR 18.85bnSAR -0.45bn10.1%9.3%100.0%
RevenueThree-year mean growthPrior-year11SAR 28.99bnSAR 35.94bnSAR 7.20bn18.9%14.9%45.5%

WAPE is total absolute error divided by total actual value; MAE is mean absolute error. Third-party history is not fully restated to a constant reporting perimeter. EPS MAPE is unstable around zero or losses.

Known limitations

  • The analysis relies on public company disclosures and third-party market data; it does not include management access, proprietary channel checks or private commercial contracts.
  • Official FY2020-FY2024 history and the FY2024-FY2025 continuing perimeter are retained as separate comparability groups and should not be combined without an explicit perimeter bridge.
  • Current consensus is a point-in-time cross-check rather than a complete historical archive of analyst-estimate revisions.
  • Adjusted EPS is forecast; reported EPS remains unmodelled until divestiture and exceptional-item accounting can be bounded reliably.
  • Public petrochemical price series are directional proxies and do not represent SABIC's realized prices or licensed institutional physical assessments.
  • Segment forecasts allocate the consolidated forecast using disclosed Q1 mix and bounded analyst spreads; they are not full product-level price-volume models.
  • The balance-sheet forecast includes an other-assets balancing line because public disclosures do not provide enough detail to forecast every asset category separately.
  • The DCF and Hold view are indicative research outputs derived from the stated assumptions; they are not guarantees or regulated investment recommendations.

Methodology and disclosures

The analysis follows standard equity-research practice: explicit investment thesis, perimeter-aware historical normalization, driver-based estimates, integrated financial statements, valuation triangulation, catalysts, risks and disclosures. Reported facts, derived calculations, forecast assumptions and analyst judgments are distinguished throughout.

Evidence and estimate hierarchy

Audited company filings and official exchange disclosures control reported facts. Company earnings releases and presentations support current operating interpretation. Third-party market data and public price series are used as cross-checks or proxies and are labelled accordingly. Forecast assumptions are analyst estimates, while the target value is a deterministic output of the stated cash-flow and valuation assumptions.

Report parameterDefinition
Information date21 July 2026
Valuation horizonTwelve months from 21 July 2026
Indicative rating frameworkBuy at total return >= 15%; Sell at <= -10%; Hold between. These thresholds are analytical conventions for this report, not formal house policy.
Status of viewIndicative research view prepared for professional evaluation; not a regulated recommendation.
Forecast EPS definitionAdjusted EPS attributable to the parent; reported EPS remains unmodelled
Scenario interpretationBear and bull cases are operating and valuation sensitivities, not statistical confidence intervals
Certification and conflictsNo analyst certification or conflicts assessment has been performed.
Intended useProfessional evaluation of the research methodology and output; not investment advice.

Material limitations

The report does not have management access, proprietary customer or feedstock contracts, licensed physical petrochemical assessments, a complete historical point-in-time consensus archive, or transaction terms that have not been publicly disclosed. These gaps limit precision and are not replaced with generated figures. External investment use requires the recipient's own suitability, conflicts and regulatory assessment.

CFA equity research report essentials, CFA company analysis and forecasting, CFA equity valuation